Schotter - Georg Nees - Part 1
Introduction
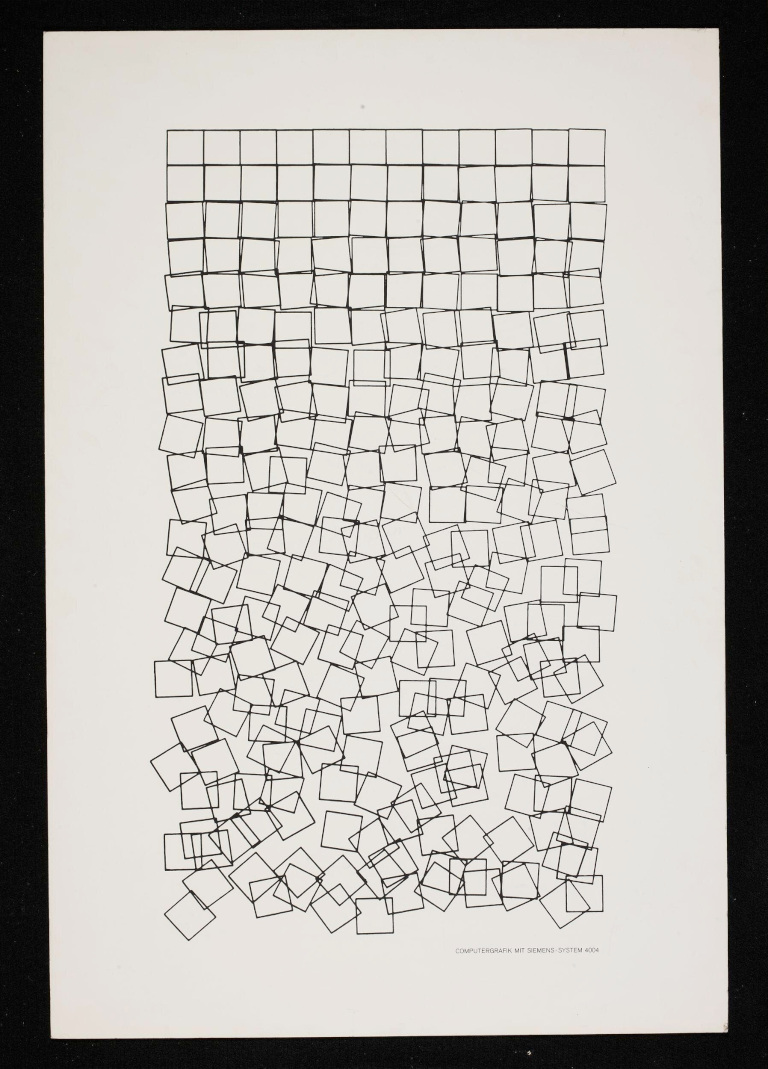 Lithograph in black ink from a computer-generated graphic, ‘Schotter’, 1968-1970, by Georg Nees. © Victoria and Albert Museum, London
As a way of dipping my toe into generative art, I’ve been trying to recreate one of the most iconic images in computer-generated art: Schotter (“Gravel”, aka “Cubic Disarray”) by Georg Nees.
Created in 1968, it was drawn using a Zuse1 Graphomat Z64 flatbed plotter.
I found many online tutorials on recreating it, mostly using Processing or its successor, p5.js, but they almost always either (a) used the same random number (scaled) for offset and rotation, or (b) eyeballed the original plot and came up with something that worked.
Original code
With some digging, I was able to find a record of the original source, in a German presentation from 2016:
1   'BEGIN''COMMENT'SCHOTTER.,
2   'REAL'R,PIHALB,PI4T.,
3   'INTEGER'I.,
4   'PROCEDURE'QUAD.,
5   'BEGIN'
6   'REAL'P1,Q1,PSI.,'INTEGER'S.,

7   JE1.=5*1/264.,JA1.=-JE1.,
8   JE2.=PI4T*(1+I/264).,JA2.=PI4T*(1-I/264).,
9   P1.=P+5+J1.,Q1.=Q+5+J1.,PS1.=J2.,
10  LEER(P1+R*COS(PSI),Q1+R*SIN(PSI)).,
11  'FOR'S.=1'STEP'1'UNTIL'4'DO'
12  'BEGIN'PSI.=PSI+PIHALB.,
13  LINE(P1+R*COS(PSI),Q1+R*SIN(PSI)).,
14  'END".,I.=I+1
15  'END'QUAD.,
16  R.=5*1.4142.,
17  PIHALB.=3.14159*.5.,P14T.=PIHALB*.5.,
18  I.=0.,
19  SERIE(10.0,10.0,22,12,QUAD)
20  'END' SCHOTTER.,

1   'REAL'P,Q,P1,Q1,XM,YM,HOR,VER,JLI,JRE,JUN,JOB.,
5   'INTEGER'I,M,M,T.,
7   'PROCEDURE'SERIE(QUER,HOCH,XMAL,YMAL,FIGUR).,
8   'VALUE'QUER,HOCH,XMAL,YMAL.,
9   'REAL'QUER,HOCH.,
10  'INTEGER'XMAL,YMAL.,
11  'PROCEDURE'FIGUR.,
12  'BEGIN'
13  'REAL'YANF.,
14  'INTEGER'COUNTX,COUNTY.,
15  P.=-QUER*XMAL*.5.,
16  Q.=YANF.=-HOCH*YMAL*.5.,
17  'FOR'COUNTX.=1'STEP'1'UNTIL'XMAL'DO'
18  'BEGIN'Q.=YANF.,
19  'FOR'COUNTY.=1'STEP'1'UNTIL'YMAL'DO'
20  'BEGIN'FIGUR.,Q.=Q+HOCH
21  'END'.,P.=P+QUER
22  'END'.,
23  LEER(-148.0,-105.0).,CLOSE.,
24  SONK(11).,
25  OPBEN(X,Y)
26  'END'SERIE.,
Nees’ comments:
«Image 38 [«Schotter»] is produced by invoking the SERIE procedure […]. The non-parametric procedure QUAD serves to generate the elementary figure which is reproduced multiple times in the composition process controlled by SERIE. QUAD is located in lines 4 through 15 of the generator. This procedure draws squares with sides of constant length but at random locations and different angles. From lines 9 and 10, it can be seen that the position of a single square is influenced by random generator J1, and the angle placement by J2. The successively increasing variation between the relative coordinates P and Q, and the angle position PSI of a given square, is controlled by the counter index I, which is invoked by each call from QUAD (see line 14).»
Python translation
With a few helper functions and ugly uses of global, we can write a
Python implementation that is almost just a transliteration.
Helper functions
import math
import random
import drawsvg as draw

d = draw.Drawing(250, 250, origin='center')
p = None

def LEER(x,y):
    global p
    if p is not None:
        d.append(p)
    p = draw.Path(stroke='black', stroke_width='0.5', fill='none')
    p.M(y,x)

def LINE(x,y):
    p.L(y,x)

def CLOSE():
    if p is not None:
        d.append(p)

JE1 = JA1 = JE2 = JA2 = 0
def J1():
    return random.uniform(JE1, JA1)
def J2():
    return random.uniform(JE2, JA2)

def SIN(x):
    return math.sin(x)
def COS(x):
    return math.cos(x)
Transliteration
# SCHOTTER
R = 5 * 1.4142
HALFPI = 3.14159 * 0.5
PI4T = HALFPI * 0.5
I = 0
P = Q = PSI = 0.0

def QUAD():
  global I, JE1, JA1, JE2, JA2

  JE1 = 5*I/264
  JA1 = -JE1
  JE2 = PI4T * (1+I/264)
  JA2 = PI4T * (1-I/264)
  P1 = P+5+J1()
  Q1 = Q+5+J1()
  PSI = J2()

  LEER(P1+R*COS(PSI), Q1+R*SIN(PSI))
  for S in (1,2,3,4):
    PSI = PSI+HALFPI
    LINE (P1+R*COS(PSI), Q1+R*SIN(PSI))
  I += 1

def SERIE(QUER, HOCH, XMAL, YMAL, FIGUR):
  global P, Q

  P = -QUER * XMAL * 0.5
  Q = YANF = -HOCH * YMAL * 0.5

  for COUNTX in range(1, XMAL+1):
    Q = YANF
    for COUNTY in range(1, YMAL+1):
      FIGUR()
      Q = Q + HOCH
    P = P + QUER
  LEER(-148.0, -105.0)
  CLOSE()

SERIE(10.0, 10.0, 22, 12, QUAD)
# /SCHOTTER
Output
Finally, it just looks right!
For more details on the converstion, as well as a more idiomatic Python version, see the Jupyter notebook.
To go further down the rabbit hole, continue to part 2…
- Part one: Schotter: Introduction
- Part two: Schotter: Investigation
- Part three: 23 ecke
-
Yes, that Zuse, Konrad Zuse. ↩︎